Self-Service Analytics Through Conversations
Hireroad I 2024-2025
OVERVIEW
ASK PIA is a conversational AI tool within People Insight that enables users to ask questions in plain language and receive personalized analytics reports. Designed to introduce modern AI capabilities without requiring a full platform rebuild, ASK PIA helped non-technical users access insights independently—reducing reliance on the CX team and working around technical limitations in the existing Tableau-based interface.
Learn more about what People Insight does.
PROBLEM
ASK PIA is a conversational AI tool within People Insight that enables users to ask questions in plain language and receive personalized analytics reports. Designed to introduce modern AI capabilities without requiring a full platform rebuild, ASK PIA helped non-technical users access insights independently—reducing reliance on the CX team and working around technical limitations in the existing Tableau-based interface. Learn more about what People Insight does.
RESEARCH
-
CX support tickets showed users repeatedly requested help with the same analytics questions—turnover trends, talent acquisition metrics, performance breakdowns. These weren't edge cases; they were fundamental questions users couldn't answer independently.
The friction: users needed to know which dashboard to open and how to filter it before getting insights. Non-technical users had legitimate questions but lacked the tool expertise to answer the
APPROACH
Leadership wanted AI in the product, but Tableau's constraints made interface changes difficult. I designed ASK PIA as a standalone conversational tool that delivered AI capabilities without a platform rebuild, while solving a real problem: letting non-technical users get answers without the CX team.
I structured suggested questions by topic (Turnover, Talent Acquisition) based on common CX requests, guiding users toward insights without needing to understand the underlying data structure. Responses combine narrative explanations with data tables, and users can export PDFs or revisit conversation history. The system generates responses that combine narrative explanations with structured data tables, allowing users to understand trends contextually. Users can export reports as PDFs and access conversation history, making insights reusable without re-asking questions.

SOLUTION
Guiding users to avoid dead ends
Even though users can type free-form questions, I designed prominent suggested questions organized by topic to reduce the chance of AI fallbacks or unhelpful responses. By surfacing common questions like "What are the turnover trends over the last 4 months?" or "How does turnover compare to last year?", users can click to get immediate answers rather than guessing what phrasing works. This lowers friction for first-time users while still preserving flexibility for custom queries.


The design change from horizontal carousel with fragmented options to vertical list with complete questions represents a strategic shift toward explicit user guidance. By showing users complete, well-formed questions, the interface teaches the required query structure (department + timeframe) through example rather than instruction. This reduces failed queries, decreases user frustration, and increases successful report generation—ultimately improving the product's core value delivery.
The evolution reflects a deeper understanding that in conversational AI interfaces, users need to learn the "language" of successful queries, and the best way to teach that language is through clear, complete examples rather than abstract fragments.
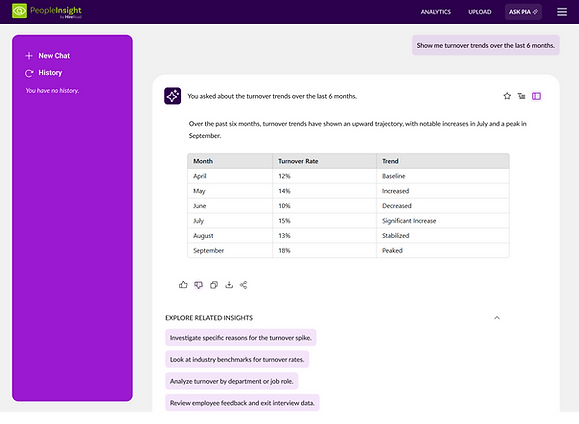
Structuring responses for clarity and action
AI responses combine narrative context with structured data, giving users both interpretation and raw numbers. Users can toggle between table and graph views depending on their preference—some want to see exact figures, others want visual trends. Each response includes actions: thumbs up/down for feedback, share, and copy buttons, making it easy to extract insights for presentations or share with teammates.


Different users, different needs: executives want visual trends, analysts need exact numbers. Letting users choose their format upfront—and when data doesn't support a visualization type, The UI explainswhy rather than fail silently.
Enabling deeper exploration
Below each response, I included an "Explore Related Insights" section with follow-up prompts tailored to the current question. If a user asks about turnover trends, they might see suggestions like "Look at industry benchmarks for turnover rates" or "Turnover comparison: Products vs. Non-Products departments." This helps users dig deeper without needing to think of the next question themselves, creating a guided exploration flow.

WHT NEXT?
ASK PIA successfully reduced CX dependency for basic analytics questions and validated that users preferred conversational interfaces over navigating pre-built dashboards.
Designing the next evolution: Automatic report generation
The success of ASK PIA led directly to a second phase: automatic report generation. Rather than waiting for users to ask questions, the system would proactively surface insights based on user behaviour, role-specific needs, and data patterns.
I designed the complete experience for this feature—how users would receive automated insights, customize report preferences, and manage ongoing deliveries. The interface balanced proactive suggestions with user control, ensuring the AI felt helpful rather than intrusive.
This feature was fully scoped and designed but didn't reach production before I was laid off in January 2025 due to company restructuring. However, it demonstrated the potential for AI to move from reactive (answering questions) to proactive (anticipating needs), informing the broader product roadmap for People Insight.